Keeping Intercom up


Our goal for Intercom availability is that each of our public facing endpoints (In-App Messenger, the Intercom web application and public facing APIs) have greater than 99.9% availability – this means being down for no more than 45 minutes a month.
This is the second of our regular posts where we provide an update on our operational performance and some of the technical detail on what we’ve been doing to improve the availability and performance of Intercom. Reminder – you can get real-time updates and data on our performance from our status page.
Main architecture notes for Q4 2014:
- We migrated our MongoDB cluster from a third party hosted platform to a self-managed cluster in our own AWS VPC, using MongoDB’s MMS to assist us with building and operating the cluster. We also made changes to our MongoDB client side configuration, and both of these changes have contributed to lower latencies and error rates.
- Searches in our UI use ElasticSearch as the backend, significantly speeding up the response time and reliability of searches.
- We updated the TLS/SSL configuration for all our endpoints. SSL Labs rates each of our endpoints as “A+”.
and here’s our Q4 2014 numbers:
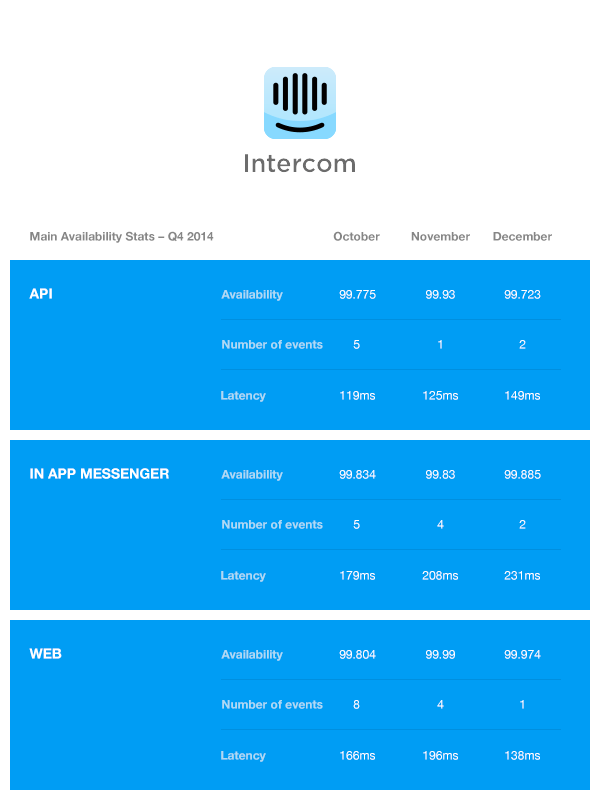
Note that the In App Messenger endpoint is also known as our Ping or JS API.
We did not meet our goal of 99.9% availability in Q4 2014. The main two causes of us missing this goal were also the reasons for us having a rough January and February 2015 too. We’ve since made significant progress and discoveries on both causes, so here they are.
MySQL performance issues
In late October/early November and then in late January/early February we experienced persistent performance issues with our main MySQL database. Intercom is mostly a monolithic Ruby on Rails application, using ActiveRecord as an ORM backed by MySQL and we use Amazon Web Services’ Relational Database Service to host our MySQL database. Both the application and database have accrued some complexity over time, and we’ve done a number of things to reduce this complexity – for example, our customer’s user data and events are in separate dedicated datastores, and we’ve built a number of smaller services that do standalone functions. However, Intercom is growing fast, and ships frequently. The workload is both difficult to predict and growing fast. On one hand, this is what traditional RDBMs are great at – they’re versatile swiss army knives capable of dealing with diverse workloads. On the other hand, they’re unpredictable complex beasts that are notoriously difficult to manage.
The nature of the MySQL performance problem was that around the busiest time of our day, the number of active threads running would jump by a factor of 1000, throughput would plummet and the reported CPU use would jump from around 10-15% to 90% or so. Failing over the database to a read replica would get things working well again. We repeatedly looked for bad queries or spikes of requests, to no avail.
We worked initially with AWS, and later engaged external MySQL consultants, to assess the general health of the database and assist with stabilising it. AWS disabled transparent huge pages on our RDS instance, we made a number of tweaks to MySQL tunables and how our application was using connection pools to connect to MySQL – these actions stopped the regular outages. We also started collecting a lot more low-level information about the performance our MySQL instance – though we were somewhat limited here by the nature of using a managed service.
When the problems returned in the new year, the MySQL metrics suggested lock contention was a problem, and while looking into this we discovered a number of long-running locks and transactions. Some long-running transactions could be expected as the Ruby MRI Virtual Machine that Intercom runs on can pause and do a full Garbage Collection while a thread has a lock open on the database. However we also found some of our codebase was executing other routines and in some cases calling out to external services while transactions were held open. We reduced the number of long-running transactions along with reducing the lock-wait timeout, so that waiting for locks would quickly error out instead of piling up. These made the performance events shorter with less serious impact, and didn’t require a failover to recover.
We also discovered that a large proportion of the transactions being opened on our database were being rolled back. The volume of rollbacks were causing some additional load, and at the very least it was worth ruling out as contributing to the stability problems. The cause was related to how new types of custom data are processed on Intercom’s side – each custom data field is inserted into a row in a MySQL table, however if the type of custom data couldn’t be determined, our code still attempted to insert the newly discovered custom data with a null value… which then (correctly!) failed at the MySQL level due to database constraints. A simple check ensured a non-zero custom data would not attempt to be written to the database solved made rollbacks an infrequent occurrence.
One of the problems of working in a fast changing environment is identifying what has changed. On an application, code or infrastructure level, this isn’t too difficult thanks to version control and audit trails. However databases don’t typically log queries, and it’s hard to discover new queries or changes in the frequency of queries, and most importantly the exact origin of them. We built an SQL query fingerprinter by extending Ruby on Rails’ ActiveRecord and built a simple UI to navigate the data collected and make discovering new queries and trends easy. We may consider open-sourcing this at some stage in the future, though it’s a little locked into how we gather and store metrics right now.
Ultimately what got us back to stability was reducing the overall load on the database. It was becoming clear that the problems we were experiencing probably didn’t have a single trigger and that reducing load in general would help. The load on the database was and remains overwhelmingly read-heavy, and while there was some caching in the app, there was no common caching framework used throughout or consistent approach applied. Enter Shopify’s IdentityCache. This looked like a great fit for what we were doing – implementing caching across a large existing Ruby on Rails application, while not wanting to write a lot of new code and retaining full control of what uses caching. To use IdentityCache we had to make numerous changes to our ActiveRecord models and make the callers use IdentityCache’s methods to lookup cached entries. The work here is not yet complete – but thanks to the SQL query fingerprinting, we’ve been able to focus our efforts on the most common types of database queries.
Being robust against Redis woes
Redis is used as a low-latency datastore for transient data by Intercom, mostly for cached data and short-lived counters. It is a reasonably good choice of datastore for these purposes. In late December and mid-February we had two similar events which took some time to resolve, around an hour of downtime each. Both of these events were triggered by the degraded performance of a single Redis node.
Most of the code calling Redis employed circuit breakers to ensure that a single degraded Redis node would not break Intercom. When tested in isolation the circuit breakers worked as designed, however what they did not protect against was Redis being called a large number of times per API request (over 100 in some cases), and all of those requests being a lot slower than usual. Intercom obviously needs to be robust against the degraded performance of a single Redis node, and we hadn’t anticipated the frequency of Redis being called from our application. To address this we’ll be reducing the frequency of calls made to Redis, improving how the application automatically detects and responds to such problems, and running game-days that verify the correct behaviour (likely using Vaurien to simulate a slow-running Redis node – we’ve already used it successfully to simulate issues with HTTP services).
Challenging and fun
The summaries above attempt to neatly condense a lot of blood and guts and chaos down to a readable narrative. We tried a lot of things that didn’t work or had minimal impact, and encountered a number of red herrings along the way. We learned more about our product and how to think about data storage and resilience as we continue to grow. It’s challenging and fun to work in environments experiencing high growth and where your work contributes directly to a product that your customers love to use. If working on building great things is something you’re interested in, here’s the obligatory “we’re hiring” link.